by Charles Kinniburgh
on behalf of The Friends of the Fallowfield Loop
(May 2022)
There is one pressure sensor on the Loop located near Yew Tree Road bridge. It is operated by Transport for Greater Manchester. The sensor generates a count each time a bicycle passes over it and can distinguish the direction of travel. Each count can be considered to represent a separate trip but does not say anything about the number of distinct cyclists involved in these trips. The counter does not record pedestrians and therefore says nothing about overall usage of the route.
We only have the first 3 months of data for 2022 at present. Pre-pandemic, the number of trips per day was averaging at approximately 300 trips and this roughly doubled during the pandemic (approximately 500 and 700 for 2020 and 2021 respectively).
Total counts in each day
The 24 hourly counts for each day were summed to give the Total Daily count and this is shown in Fig. 1. The red dots represent the counts for weekdays and the blue dots for weekends. The 4 gaps when no data is available can be clearly seen.
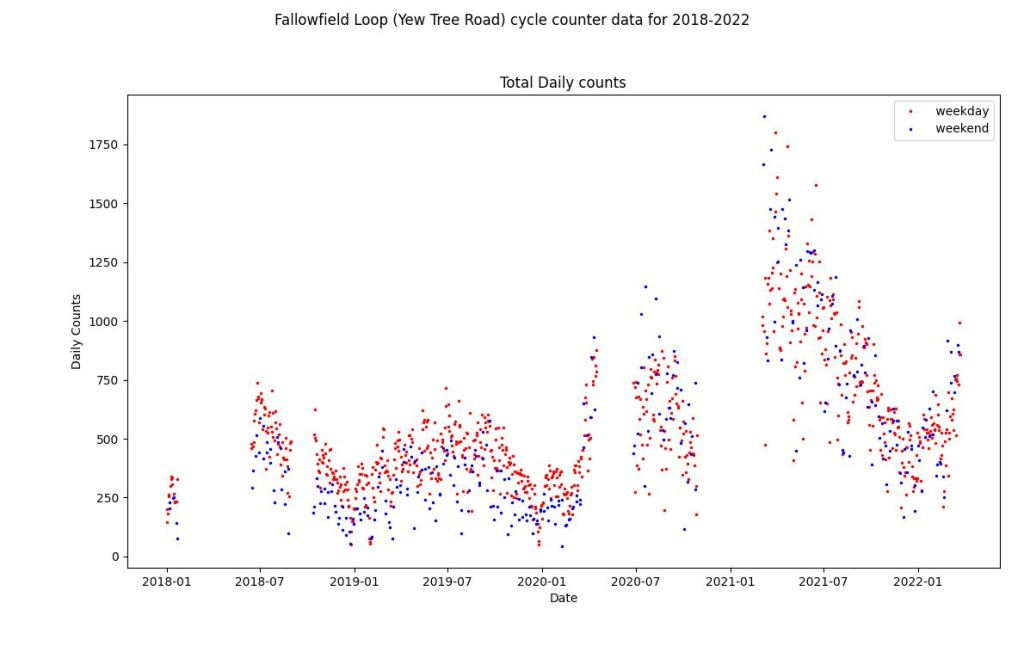
Fig. 1 : Total Daily Counts
In general there are reasonably large day-to-day variations in the counts particularly at weekends, probably due to the weather. However the main annual variation can be seen with peaks in the summer months and minima around the New Year. It can be seen that the summer peaks for 2018 and 2019 are similar and then there is an increase in 2020 and a further increase in 2021. Before Spring 2020, the weekday traffic generally exceeds the weekend traffic presumably due to the contribution made by commuters. After Spring 2020, this difference is no longer apparent and is a result of the increase in leisure cycling on the route. The significance of Spring 2020 is that this is when the first lock down for the COVID19 pandemic happened.
Despite large day-to-day variations, there are some clear trends visible in the data:
Commuting peaks centred on 8am and 4pm on weekdays – these did not change significanly during the pandemic
An approximate trebling of weekend trips and doubling of weekday trips during the pandemic compared with pre-pandemic
Average daily count – variation by month
The available counts for each month were summed and divided by the number of days of data to give a daily average for each month for which data were available.This is shown in Fig. 2 where each year is shown using a different colour.
Fig. 2 : Average Daily Count by year and month
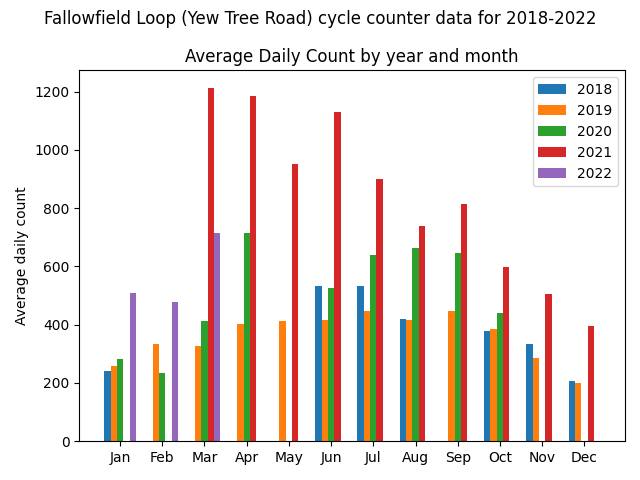
It can be seen that 2018/2019 are similar and can be considered to represent a base case being pre-pandemic. In round figures these base numbers range from about 200 per day during winter months to about 500 per day during summer months. In 2020, the summer peak is broadened and in fact the the highest monthly average is in April at about 700 per day. Then in 2021, a similar profile is seen with a peak of about 1200 per day in April 2021 falling over the following months to about 400 per day in December 2021. Because of the missing data, it is not possible to reliably estimate total numbers for each year but it is clear that the peak year was 2021 and that the numbers then were approximately 2-3 times the numbers before the pandemic.
Fig. 3 shows the same data plotted as a timeline.
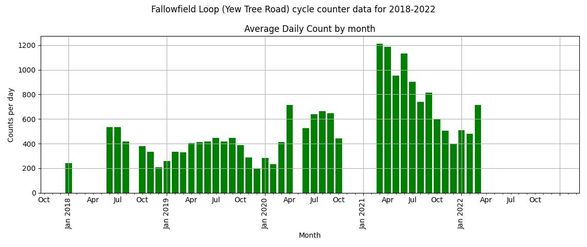
Fig. 3 : Average daily count by month
Average daily count – variation by day of week
It is presuably the case that most commuting trips for work take place during weekdays and that most trips at the weekend are for leisure/errands. Fig. 4 shows the average daily count for each day of the week for each year. Again this average is calculated by summing the days when data is available and dividing by the number of days.
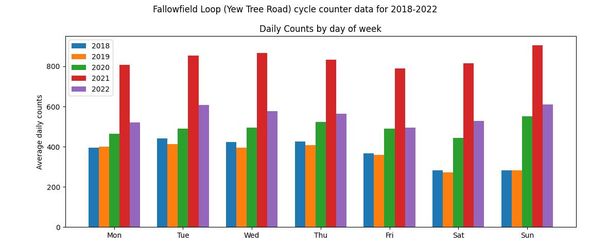
Fig. 4 : Average daily count by day of week
The effect of missing data is expected to be small especially when considering day to day variations as opposed to absolute numbers. The main effect that can be seen in Fig. 3 is that for 2018/2019, the numbers for Monday to Thursday are very steady and slightly less on a Friday. Similarly Saturdays and Sundays are similar but roughly 25% down on weekdays. This changes in 2020.2021 with all numbers up but particularly those at weekends which are now similar or slightly higher than during the week. The weekend increase will be due to more leisure/errand trips but it is not clear from this chart whether the increase in weekday numbers is due to more leisure trips or more commuting trips. This is clearer in the next chart.
Average hourly count – variation by time of day.
Fig. 5 shows how the number of trips recorded varies by time of day. Data is bulked for each year and separated according to whether the day is a weekday or weekend.

Fig. 5 : Average count rate for each hour of the day
This chart corroborates the general findings from Fig. 3 but in addition suggests that commuting was not much affected by the pandemic peaking at about 50 counts/h at 8am. The use during hours of darkness is minimal. Therefore the rise in weekday figures during the pandemic was largely due to a general increase in trips for leisure/errands which was spread evenly throughout the day. The large rise in weekend use in 2020/2021 is again clearly seen.
5. The effect of the Pandemic
The first lockdown of the COVID19 Pandemic in England occurred on 26 March 2020. This lockdown was eased over June 2020 although restrictions on numbers that could gather outdoors remained. This lockdown was followed by two further lockdowns from 5th November to 2nd December 2020 and from 6th January 2021 to 19th July 2021. There were many tweakings to what was permitted during these lockdowns but what is most relevant to the Floop usage is that at no time was there a total bar on individuals going out for some exercise on their bikes. On the contrary, it was one of the safest things an individual could do and so it is no surprise that cycle trips on the Floop show a significant increase over the course of the pandemic.
The most reliable measure of this can be obtained by comparing whole year averages before and during the pandemic. Given the restrictions started in March 2020 and there is counter data to March 2022, it makes sense to consider year periods starting in March 2018 going through to March 2022. For each of these annual periods, the average daily count has been calculated and is given in Table 1 below.
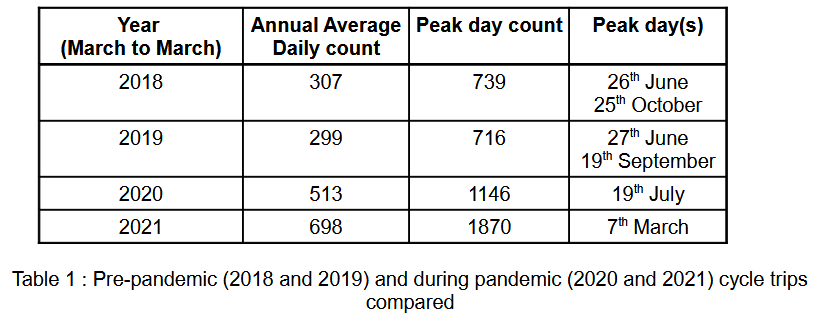
It can be seen that pre-pandemic, the number of trips per day was averaging at approximately 300 trips and this roughly doubled during the pandemic (approximately 500 and 700 for 2020 and 2021 respectively).
It was shown in Fig. 5 that commuting numbers stayed constant throughout the whole period and the main increase was due to an increase in trips in the middle of the day particularly at weekends.
6. Conclusions
1. Despite large day-to-day variations in the number of cycle trips recorded, there are some clear trends visible. For instance, the large rise in weekend use during the pandemic, the commuting v. leisure/errand use and the annual seasonal variation stand out.
2. There are some major limitations of this data. Foremost is that it only applies to one location on a 10km path and it would be very interesting to have counters at other locations. This could be part of the upcoming improvements to be carried out by
The Mayors Challlenge Fund.
3. It would also be useful to have some analagous data for pedestrian use of the path and Friends of the Fallowfield Loop are currently considering staging a physical count to gain such data.
4. Closer connections between interested parties from TfGM, Sustrans and Friends of the Fallowfield Loop would help to ensure that maximum use is made of the data collected from the Yew Tree Road counter.
